-
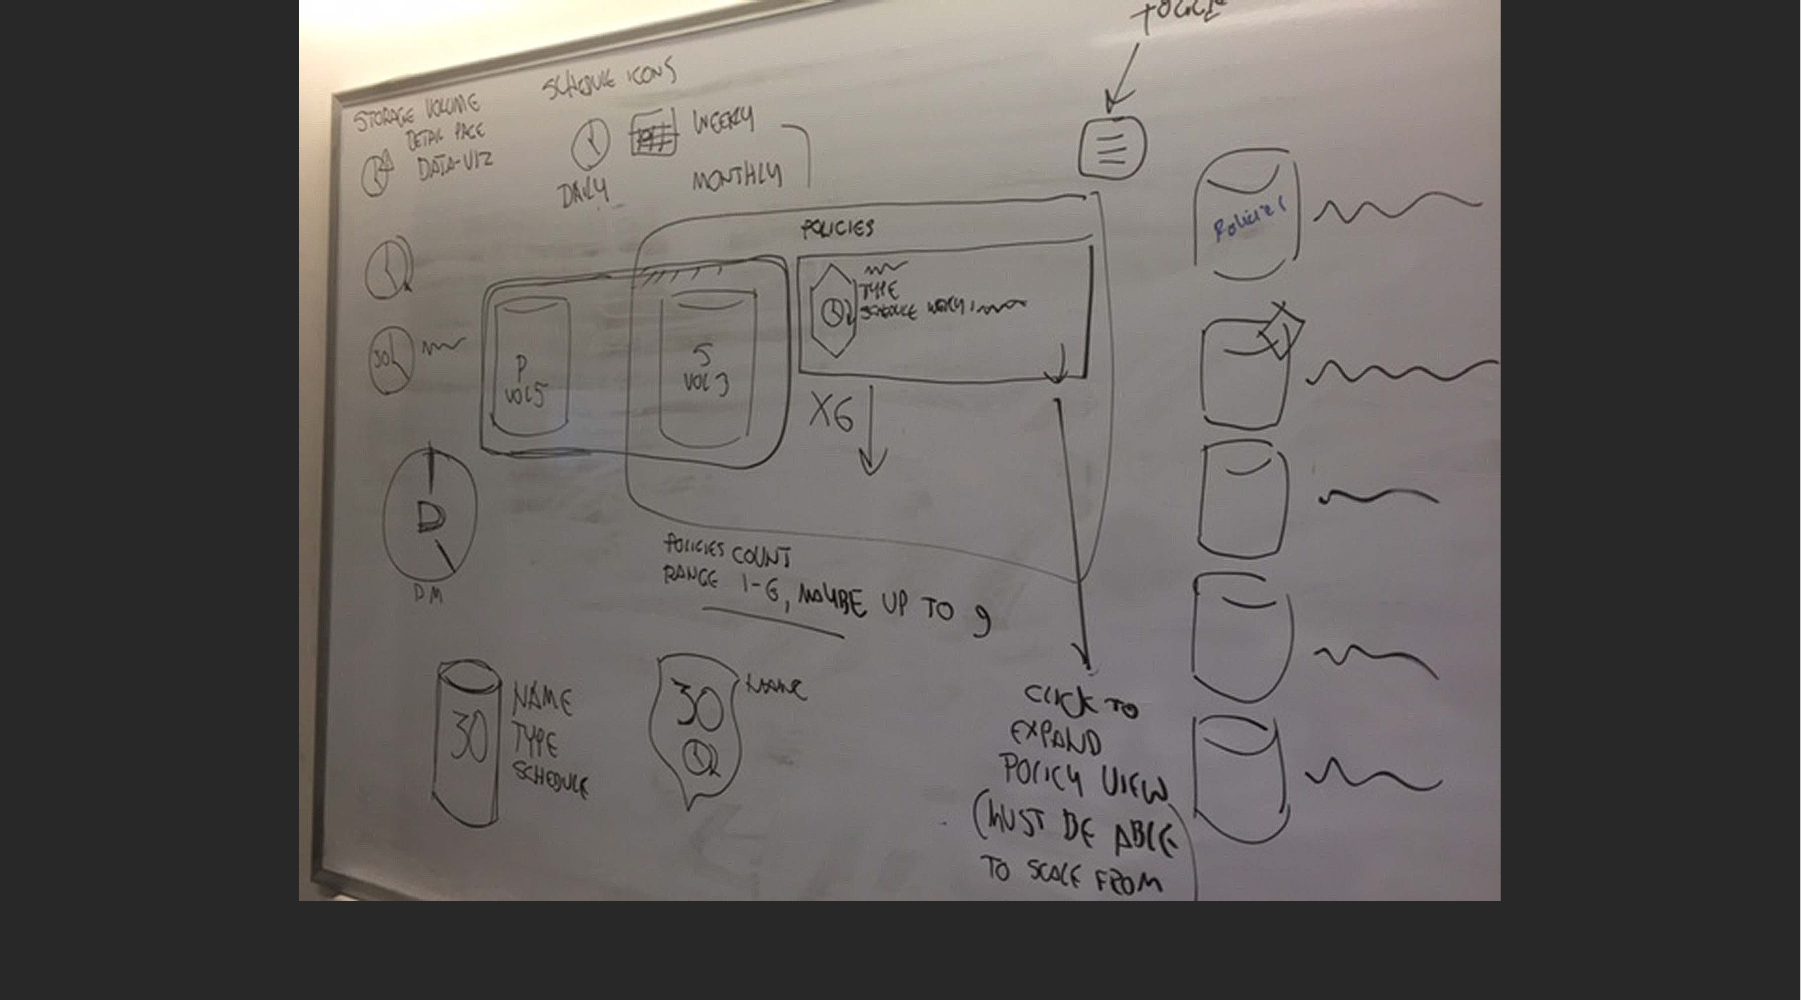
Initial concepts
Displaying the relationships of volumes as replication groups was complex.
A diagram was suggested as a way to simplify the relationships.
-
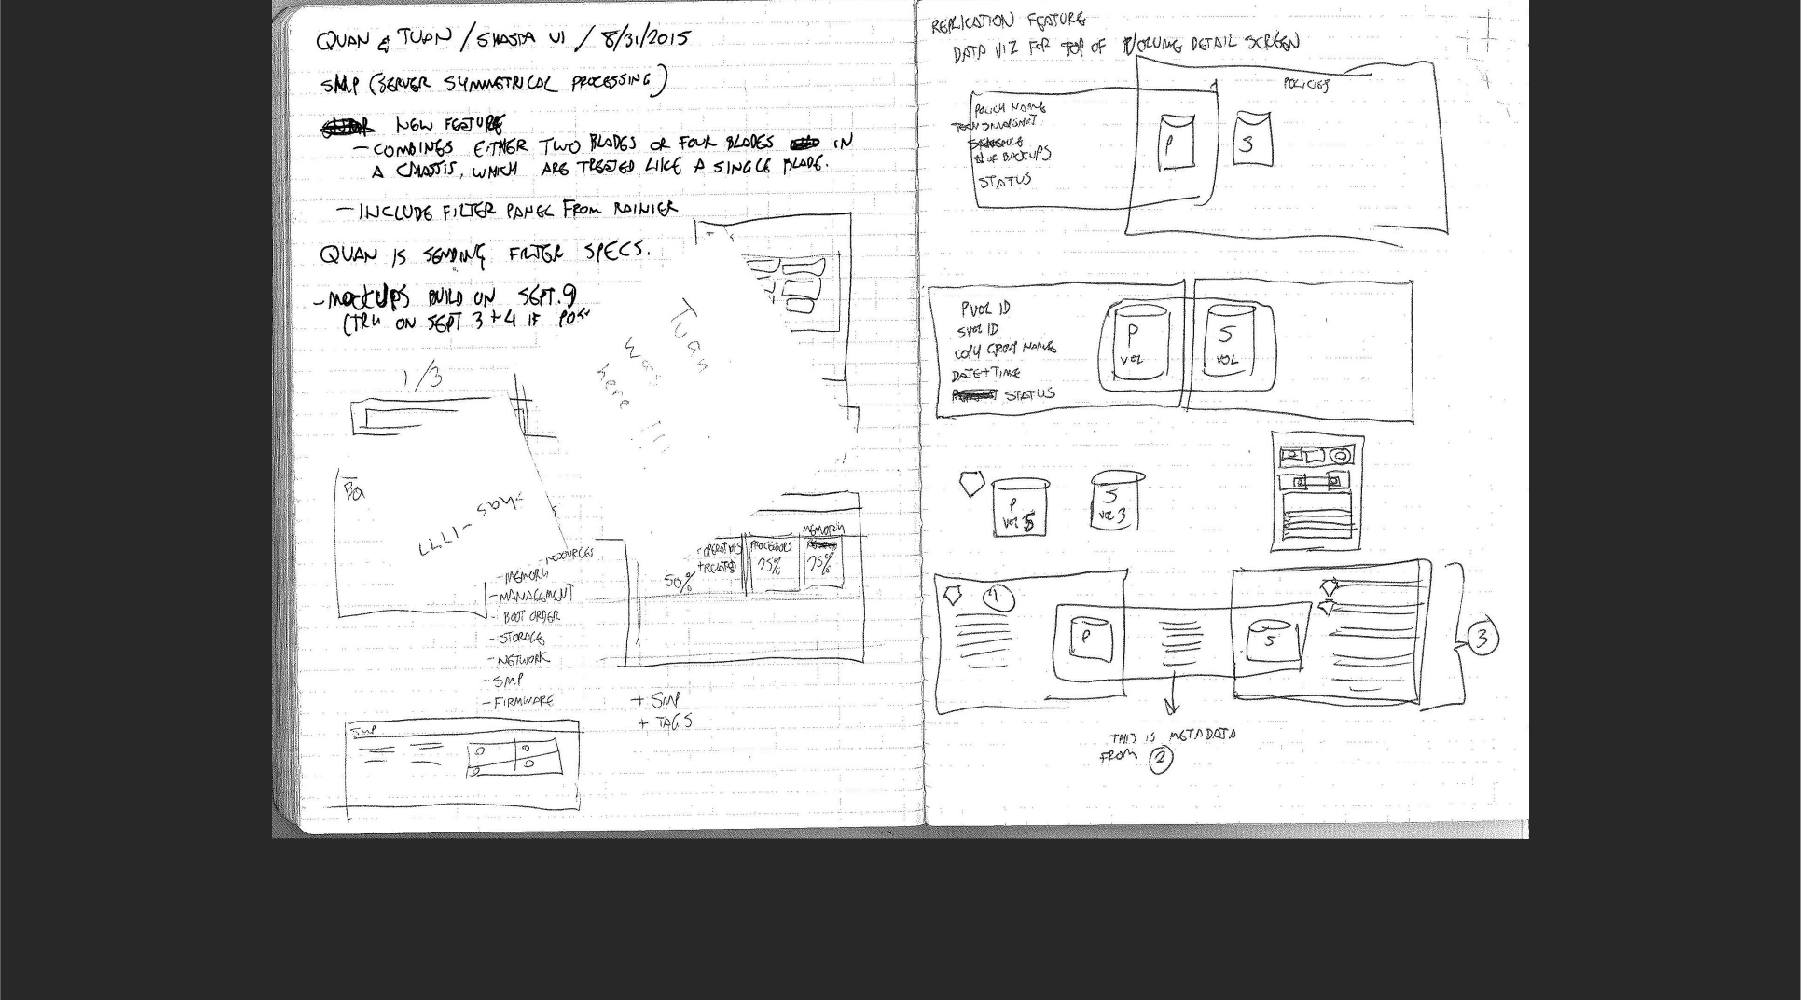
Sketches of replication group diagrams
Variations of the replication group configurations were explored.
The product owner of this feature was convinced that the complexity of the concept could be comprehended effectively with an interactive diagram.
-
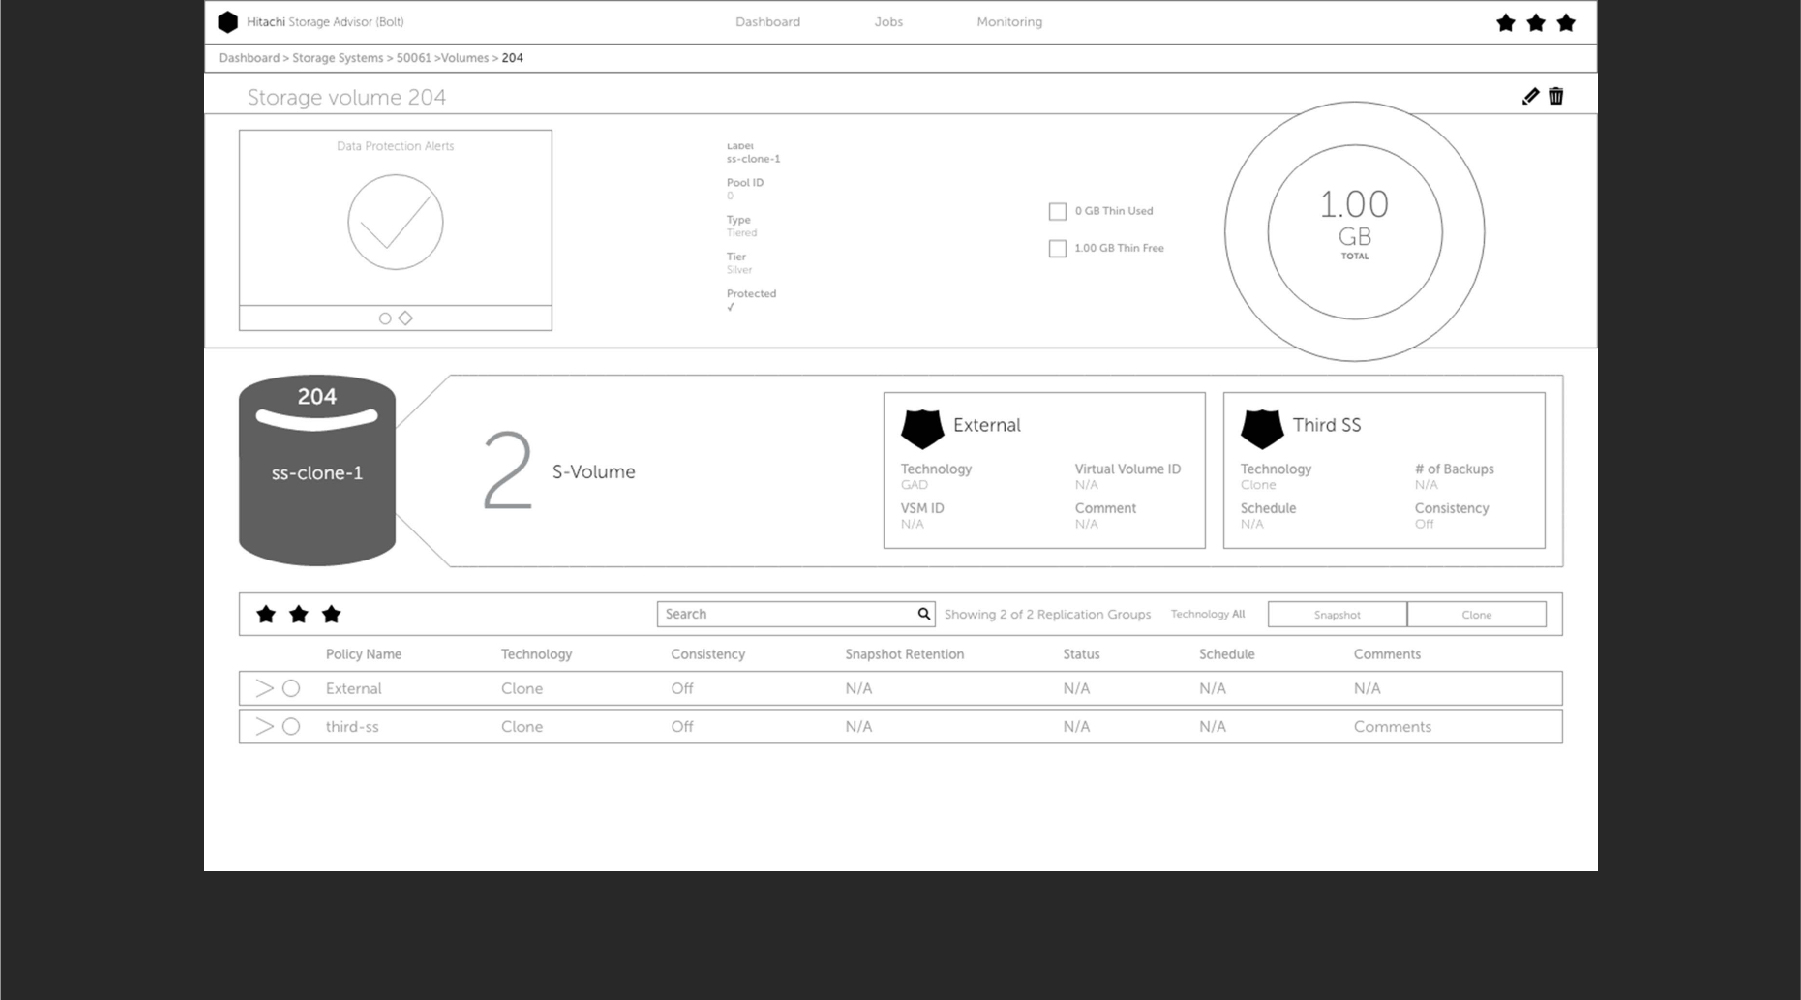
Wireframes of the replication groups feature
The wireframes helped stakeholders determine the interaction and UX of the feature with emphasis on composition without details of color and texture.
-
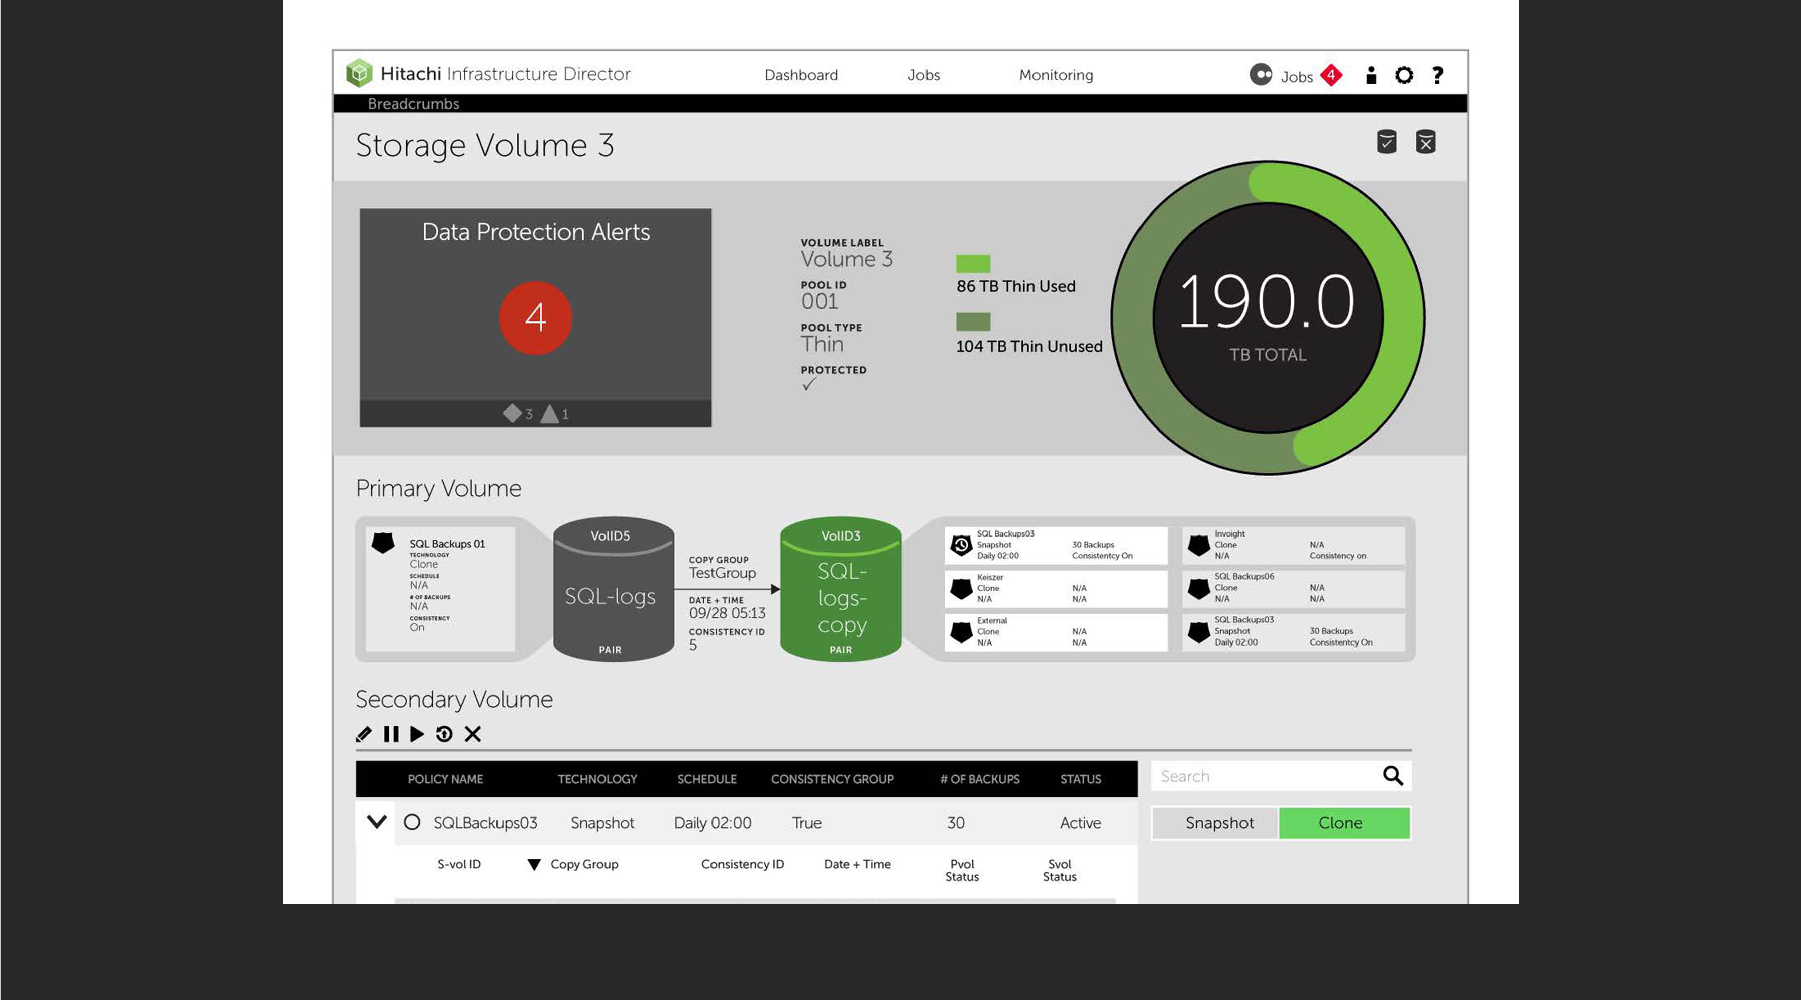
Color Mockup
The prototype was rendered in actual HTML.
A new technique for building complex SVG diagrams with symbols was constructed and tested.
-
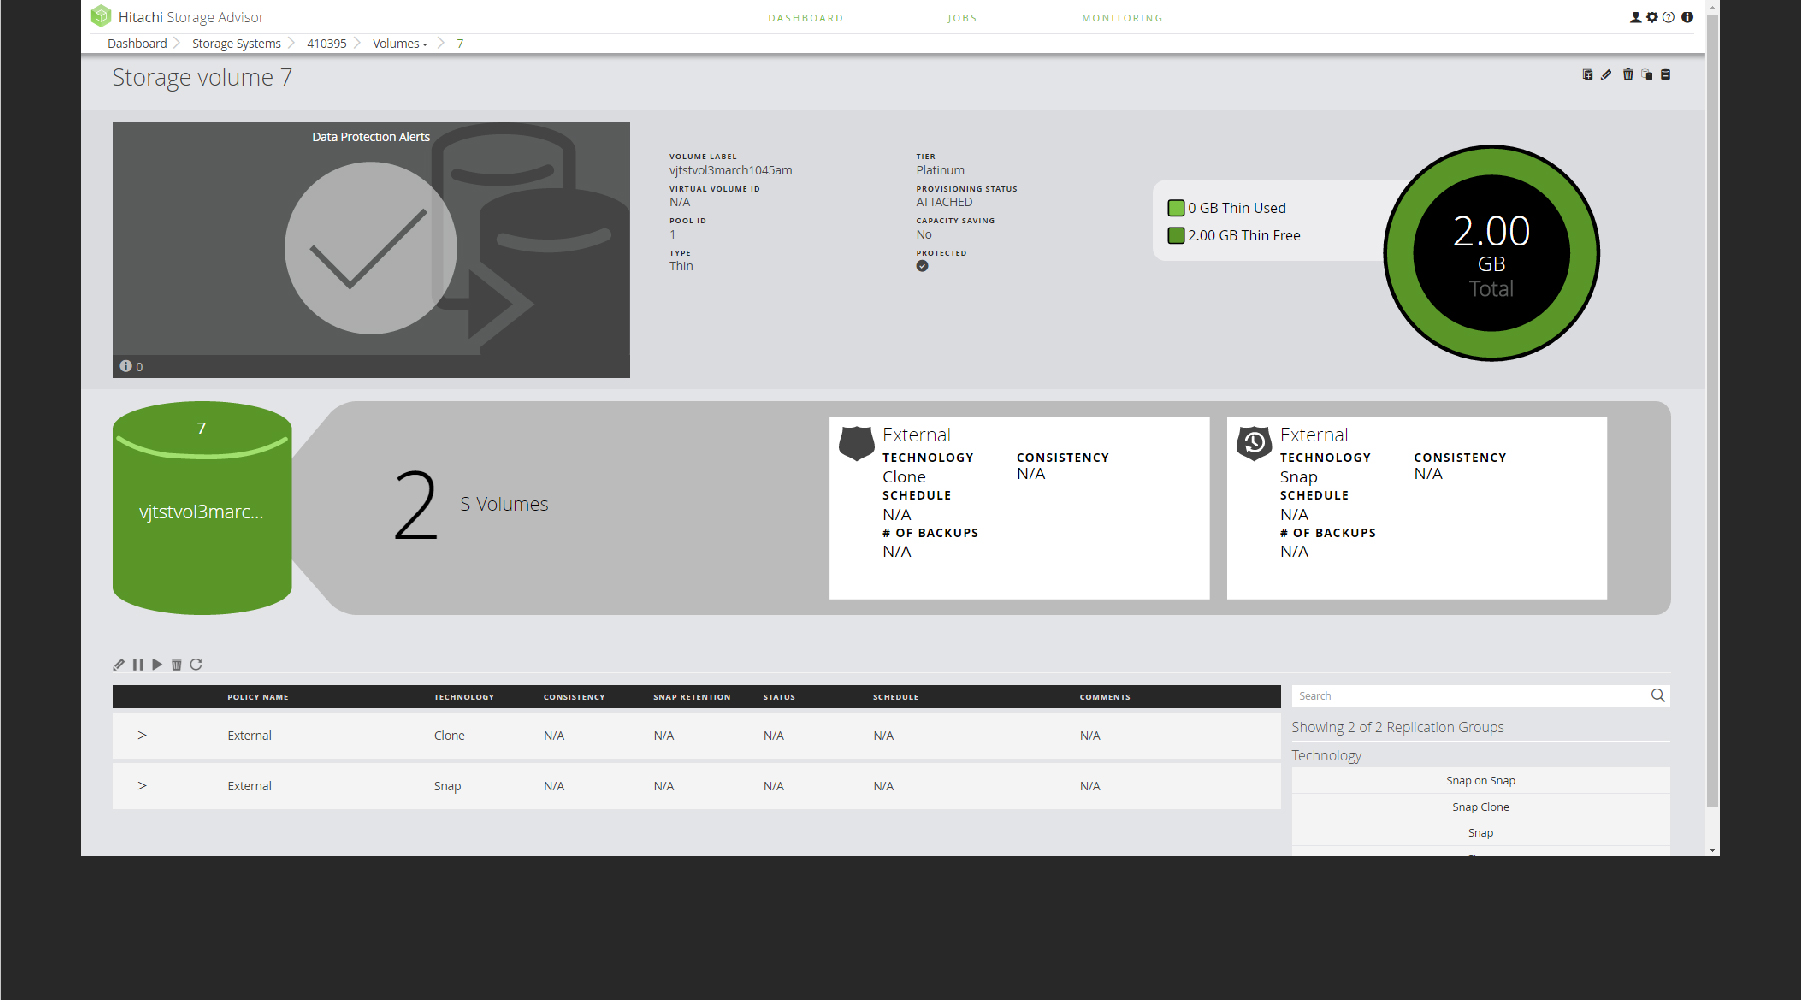
The final product
The diagram was rendered in SVG using symbols which can be manipulated with JavaScript.