Project Overview

The Market Need

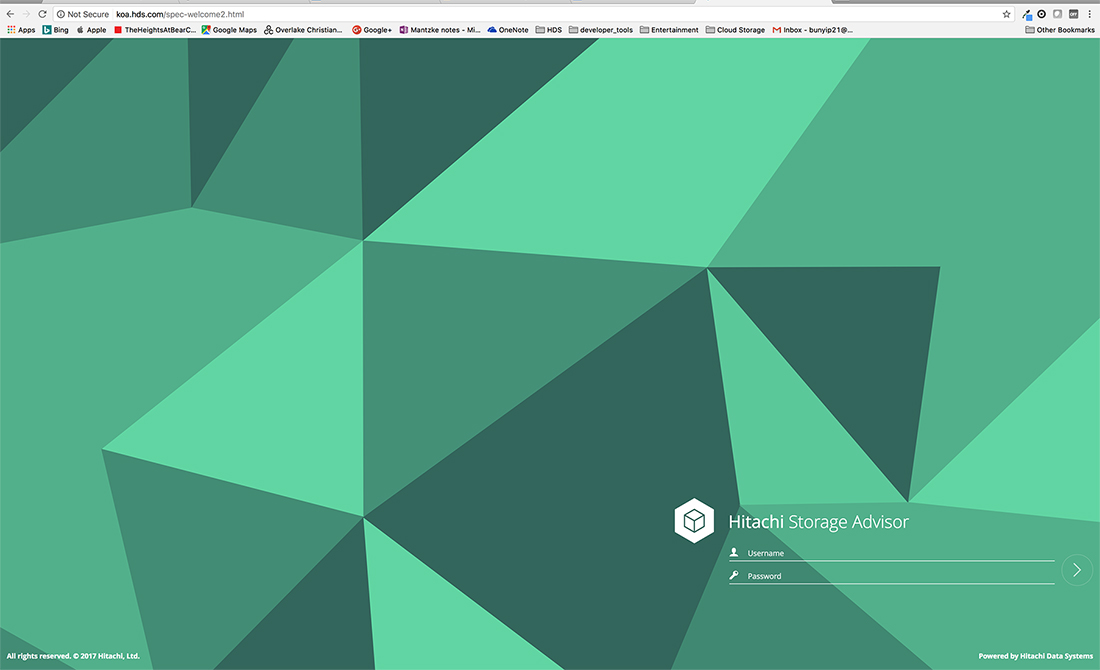
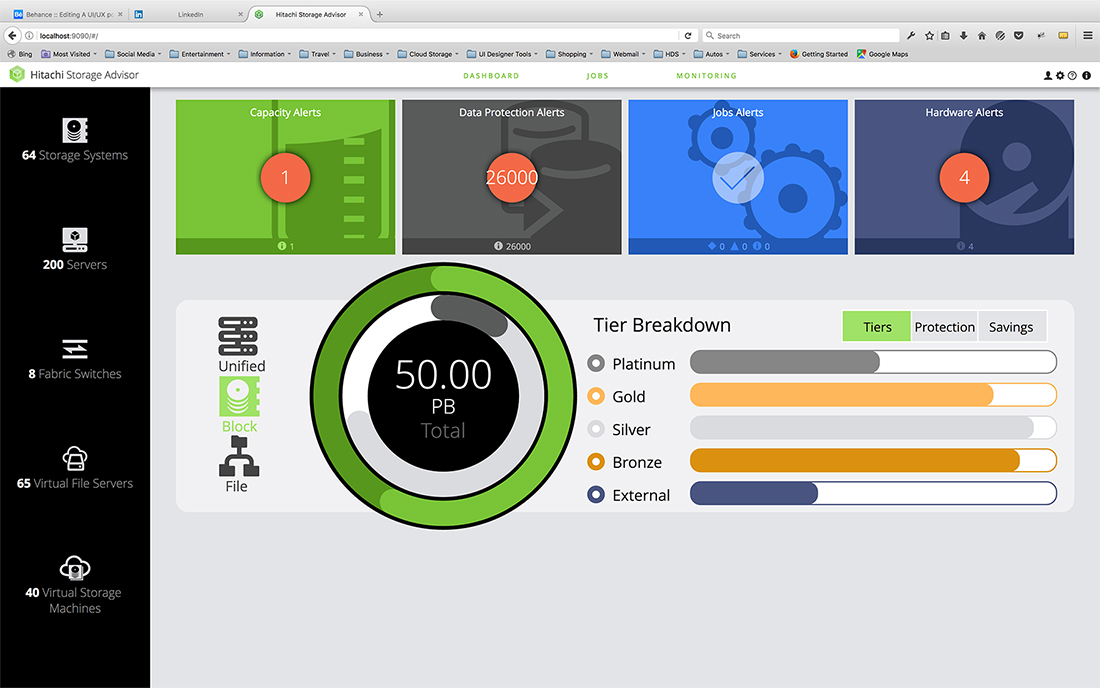
For the data center administration market, there was a need to assign storage to servers, with a streamlined and efficient workflow for allocation and provisioning. We created a solution as a web app which simplified these management task in a dashboard and various feature tasks.

My Role

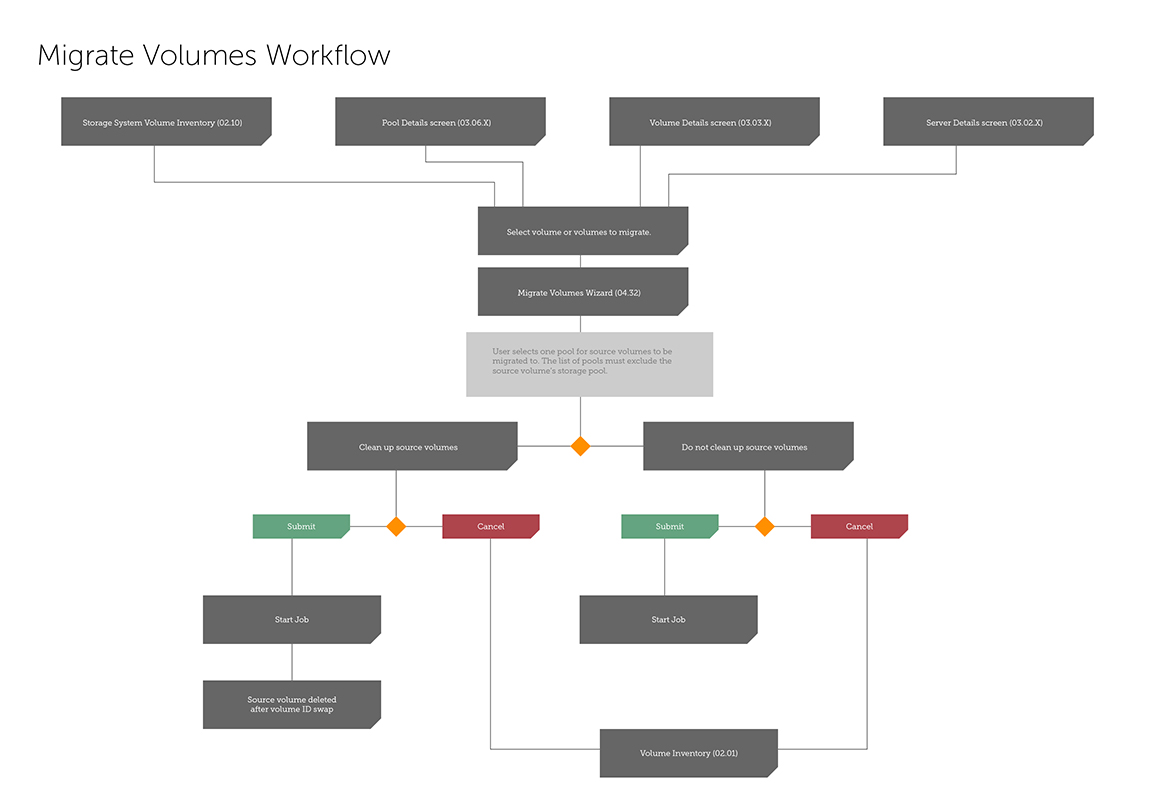
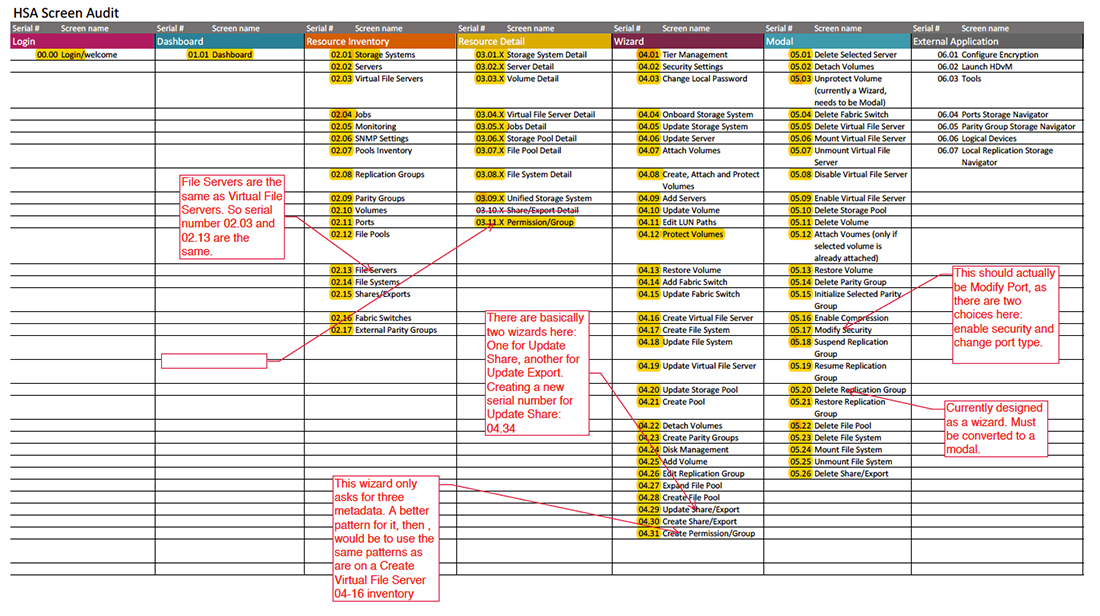
I functioned as a UX/UI designer in collaboration with two other designers. I was primarily responsible for the user workflows and tracking the UI assets. I presented design iterations to stakeholders. I also provided support for engineers and developers.

The Team

The team divided overall UX tasks for the poject by skills and strengths. This allowed us to accomplish all of the pre-production design development on time. One team member, who was strong with visual design, handled colors, icons, and mockups. Another team member, who was strong with interaction, handled wireframes and state changes.

Hitachi Storage Advisor login screen
Because this was enterprise software and needed several security layers, a clean and simple login screen was the entry point for most users. I needed to function like a lobby to a respectful company.
the final dashboard of Hitachi Storage Advisor
The design was a departure from the normal UI design of other Hitachi software products, so this product was showcased in exectutive presentations as a new direction in product design.
Rainier persona
The persona for the project initially was the Storage Administrator. Because of a tight deadline and the product managers having expert knowledge of the domain, we used them for the primary research source. Eventually we ended up with a single, generalized persona: IT Generalist.
User workflows were diagramed to determine the necessary UI components.
Each screen for each workflow was documented, assigned a template and a serial number, and published in the project wiki for reference.

Design Explorations

The domain the product was being designed for was highly technical, and user research either needed onsite interviews with target users, or interviews with the product managers who already had years of domain knowledge.

Because of the tight deadline and agile development process, we deferred to product manager's domain knowledge.

We explored intuitive user interfaces. Where engineers would default to representing information with tables, we sketched interactive diagrams and data visualizations.

white board explorations of user workflows
Many whiteboard sessions were held with all levels of stakeholders to explore optimal user experiences.
graph paper ui sketches
More detailed UI component explorations were drawn on graph paper.
the sitemap for Rainier
Each screen was given a template name and serial number for better tracking for the developer team. Each feature was given a detailed sitemap to show the templates needed.

Design Development

Design iterations were done to explore what elements to place on the dashboard.

Color schemes, icons, typography, and were developed with mockup iterations.

To ensure that the mockups were within the scope of front-end developers on the team, we discussed the designs and how they would be built. Most of this involved finding a JavaScript library to support the design.

mockup of the dashboard
This final mockup of a storage array detail screen shows most of the meta-data from any one resource. The resource inventory screen displays a list of storage arrays, with a limited set of meta-data exposed.
wireframe of the dashboard
Wireframes were completed in Adobe Illustrator, and later Adobe Experience Design. Stakeholder review was usually in PowerPoint or Acrobat. Since we used an icon-font for icons, we took the assets directly from Adobe Illustrator and exported as SVG to convert to the font.
data-visualizations
The design team advocated creating innovative data visualizations to improve the experience for the user, and optimize their worklfow.

Design Development (continued)

As each screen was developed, design patterns were established. This informed the SASS styling system.

One-on-one collaboration with the developer team ensured that the UI assets were within scope.

mockups of a complicated interactive diagram
Several diagrams were designed to combine multiple design principles and use more of the user's congnitive facilities. Working with the developer team helped establish the most effective means to construct the interactive diagrams with code. These diagrams were built with SVGs, and required many levels of SVG symbols, which were controlled with JavaScript.
an SVG topology editor
This task screen enabled the user to map physical relationships between resources with a simple drag-drop interface. It required a lot of custom JavaScript and the D3.js library.
color scheme
Once the color scheme was established and signed off by the principal stakeholders, the colors were coded with hex values and SASS variables. Each color palette was added to the documentation with the corresponding hex value and SASS variable so that the developers could reference them at any time.

Final Design

The product delivered what it set out to do. For our customers, storage management was simplified, and provisioning speed was increased.

In addition, the design was celebrated by the product management team as being a bold departure from the standard UI being developed for other Hitachi Data Systems software engineering teams.

Product managers and sales people used screen shots from Hitachi Storage Advisor in their presentations both internally and externally.

final dashboard
The user dashboard was exciting and fresh, and unexpected for users who were not used to seeing so much color and interactivity on other software products from Hitachi Data Systems.
final storage system inventory
A high-level view of a resource inventory was created, with tiles displaying only the most important meta-data for each. The inventory could be filtered, and each resource could be selected to apply specific actions to. Additionally, the user could toggle between a list view and a grid tile view.

/